• Skip to primary navigation
  • Skip to main content
  • Skip to primary sidebar
  • Skip to footer
  • Call: (+91) 9892486442
  • email: info@academicshq.com

AcademicsHQ - Educational resource hub

Comprehensive guides for students and lifelong learners

Business Analysis

  • We help business analysts, students, and managers craft better analysis.
  • Contact us for more information
  • Home
  • Research Process
  • Academic Writing
  • Referencing Guide
  • Resume Writing
Home » Blog » Benchmarking strategy tool

Benchmarking strategy tool

August 4, 2021 by academicshq Leave a Comment

benchmarking wheel

Benchmarking is a strategy tool used to compare the performance of the business processes and products with the best performances of other companies inside and outside the industry.

Benchmarking is used as a way to understand how an organization compares with others. It is a means of understanding how an organisation compares with others – typically competitors.

According to Camp, benchmarking is simply “Finding and implementing the best business practices”. Managers use the tool to identify the best practices in other companies and apply those practices to their own processes in order to improve the company’s performance.

Xerox has popularized benchmarking and was one of the first companies to introduce the process of doing it.

There are two approaches to benchmarking:

  • Industry/sector benchmarking – comparing performance against other organisations in the same industry/sector against a set of performance indicators.
  • Best-in-class benchmarking – comparing an organisation’s performance or capabilities against ‘best-in-class’ performance – wherever that is found even in a very different industry. (e.g. BA benchmarked its refuelling operations against Formula 1)

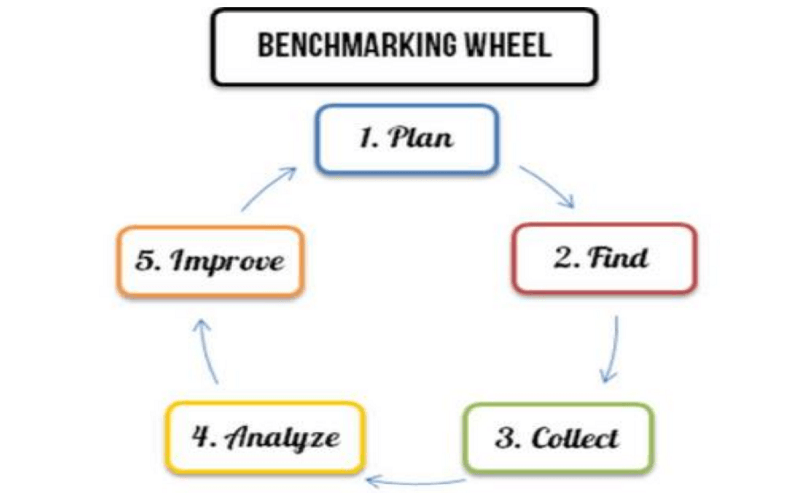
Benchmarking wheel model

The benchmarking wheel model is a 5 – stage process:

  1. Plan – Assemble a team. Clearly define what is to be compared and assign metrics to it.
  2. Find – Identify benchmarking partners or sources of information from where information is to be collected.
  3. Collect – Choose the methods to collect information and gather data for the metrics defined.
  4. Analyze – Compare the metrics and identify the gap in performance between ones company and the organization observed. Provide the results and recommendations on how to improve the performance.
  5. Improve – Implement the changes to ones products, services, processes or strategy.

Related posts:

  1. Environmental Scanning
  2. Mission, vision and value statements: Definitions & examples
  3. STEEPLE Analysis (vs PESTLE Analysis) Explained
  4. The Boston Consulting Group (BCG) Matrix
  5. The GE Planning Grid / GE 9 Cell

Filed Under: Strategic Management

Reader Interactions

Leave a Reply Cancel reply

Your email address will not be published. Required fields are marked *


Primary Sidebar

Microsoft Excel Tutorials
Want to master Excel? Check out our free tutorials on YouTube

Academic Writing: Best Practices

  • How to Choose a Research Topic
  • Academic Writing Guide: Tips & Checklist
  • How to evaluate information sources (CARS Checklist)
  • How to write Literature Review
  • Referencing (Citing) Guide: Harvard, APA and Other Styles
  • How to write conclusion for academic work

Recent Posts

  • Budgeting 101: How Firms Control Their Finances
  • A Tomato that pushes you hard
  • Types of Market Structures Explained
  • The Stability (and Instability) of the Market Economy
  • Measures of Economic Activity and Wellbeing

Footer

ACADEMIC

  • Academic Writing Guide
  • Statement of Purpose
  • Letter of Motivation
  • Personal Statement
  • Letter of Recommendation

JOB

  • Cover Letter
  • Letter of Intent
  • Resume
  • LinkedIn Profile Writing

BUSINESS

  • Pitch Deck
  • Article Writing
  • Blog Writing
  • Case Study
  • Press Release
  • Business Plan
  • Ghostwriting

ABOUT US

  • About Us
  • Contact
  • Privacy Policy
  • Blog

Copyright © 2026 · News Pro on Genesis Framework · WordPress · Log in